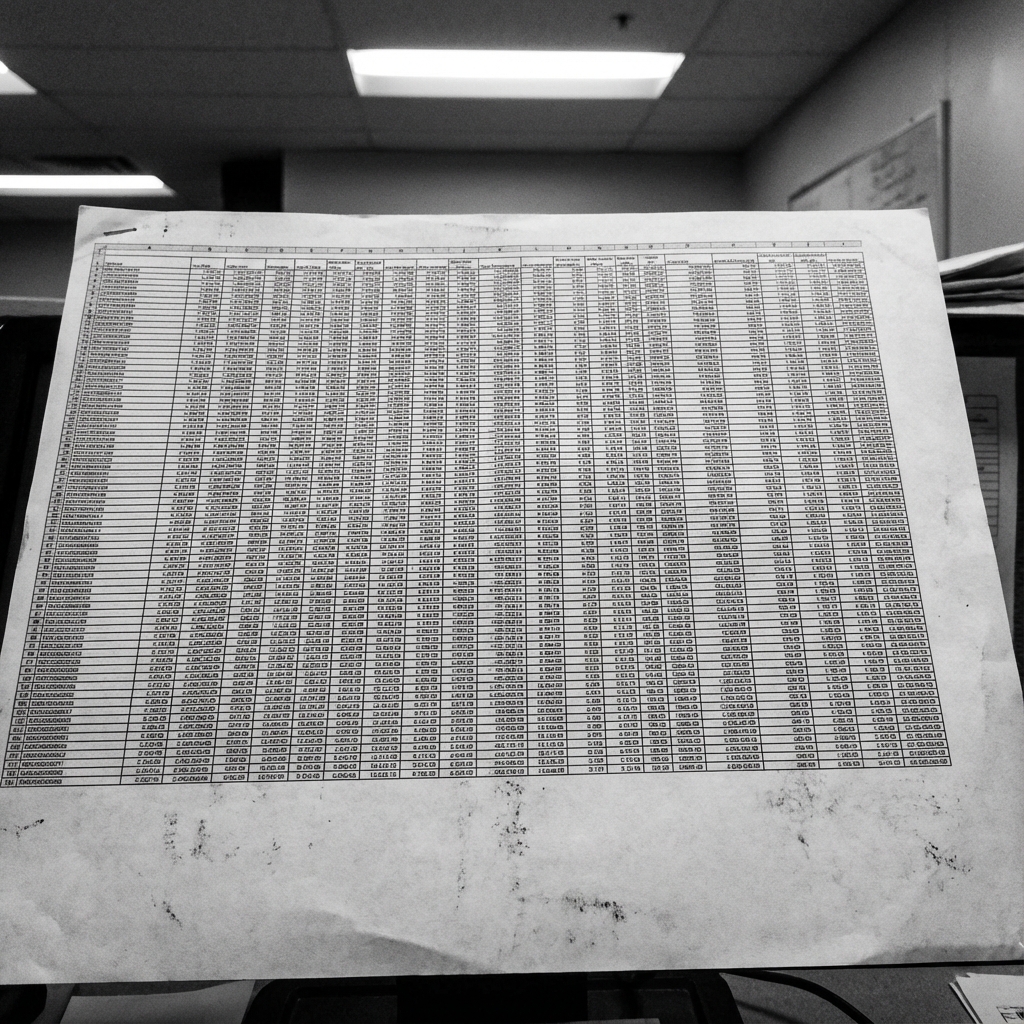
Stop Staring at Spreadsheets.
Start Seeing Answers.
Upload your raw data files and instantly generate cost tables, sales reports, and revenue analyses without writing a single formula.
Get Started
Upload your raw data files and instantly generate cost tables, sales reports, and revenue analyses without writing a single formula.
Get StartedSee the difference Raporla makes in seconds.
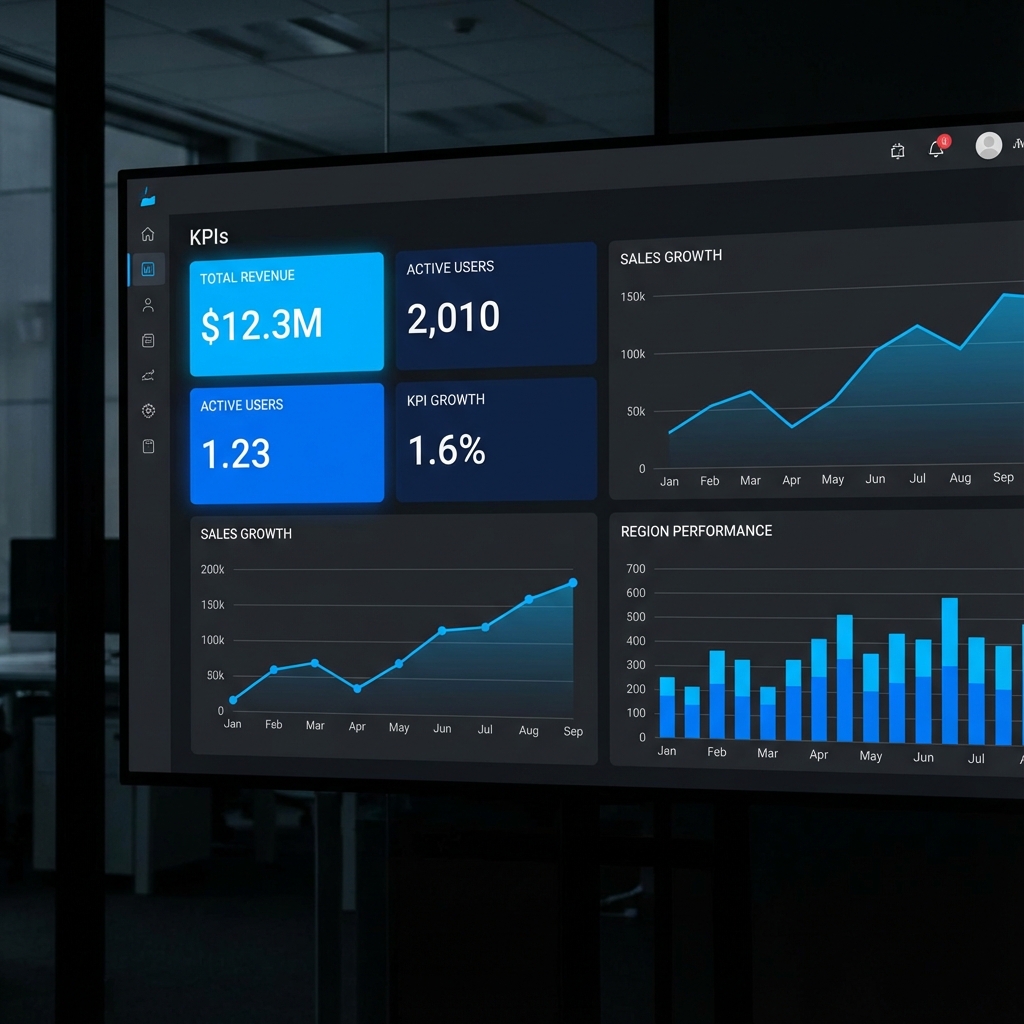
From Cost Tables to P&L statements. Visualize every penny coming in and going out with automated precision.
Track sales trends, team performance, and product metrics in one unified view. Identify your top performers instantly.
Use historical data to predict future growth and risks. Turn hindsight into foresight with our predictive AI models.
Three simple steps to data mastery.
Drag & drop your Excel or CSV.
We analyze and structure your data.
Explore your insights immediately.